Show a Volume Profile and split in Buy/Sell Volume in Plot #5795
Conversation
new features:
  - volumeProfile on the right side of the plot
  - separating the Volume and volumeProfile in
     seperate buy and sell trades
showVolumeProfile is false
adding nicer colors
adding stackmode when VolumeProfile disabled
|
In general, i'm not in favor of adding new functionalities to the plotting module at this point, as we'll be removing this way to do plots at some point in the near/mid term future in favor of freqUI (which allows basically the same plots we have at this moment, but with more interactivity, dynamically adding/removing indicators), while at the same time being able to handle more data. It's not yet 100% feature-complete/identical - which is why the existing plotting modules have not yet been removed, however, it should be considered "in maintenance mode" - which means we should not be adding new features - as this will widen the gap we have to bridge for freqUI. Instead, new functionality should be added to freqUI. In this particular case - i can see us adding support for this here, but we would want to get a PR adding the same functionality to freqUI. edit: to be clear - this does not mean we'll not merge this if we don't get a PR for freqUI - but we'll hold merging this until we find time to add it there, too. |
I will check it out later this week and see if I can create a PR for it |
| 'showBuySell': 'true', | ||
| 'showVolumeProfile': 'true', |
There was a problem hiding this comment.
wouldn't it be easier (both here and when handling it) to have it be real booleans (no quotes) - not strings?
Obviously it'll have to be True then ... but ...
|
|
||
| for i in range(len(candles)): | ||
|
|
||
| candles['volume_buy'].iat[i] = (candles['volume'].iat[i] * |
There was a problem hiding this comment.
From a quick look, i think it should be possible to vectorize this (avoid looping).
You'll see that doing so will greatly improve the speed.
i guess it'll look something along these lines:
candles['volume_buy'] = np.where(dataframe['high'] > dataframe['low'], dataframe['volume'] * <....>), 0)
| VolumeProfileHistoryBars = volume_config['VolumeProfileHistoryBars'] if \ | ||
| 'VolumeProfileHistoryBars' in volume_config else -1 | ||
| VolumeProfilePriceRangeSplices = volume_config[ | ||
| 'VolumeProfilePriceRangeSplices'] if 'VolumeProfilePriceRangeSplices' in \ |
There was a problem hiding this comment.
The naming of these 2 variables is very missleading / confusing, as it doesn't really adhere to python standards.
In python, it's common to use lowercase variable names (in snake_case formatting).
capitalized names are usually classes (this is also visible by the color highlighting github applies).
I'd therefore: leave the settings as they are (it's a json object, so capitalization is not that important)
Modify the python variables to follow at least some style (so at least color highlighting is not broken) - to avoid confusing your friendly reviewer 😆
|
is this still alive? looking for something exactly like this |
|
not ... really - and based on the discussion in #6845 - it's also not very likely to be accepted, as apparently the volume profile calculation is not accurate this way. |
Summary
I missed a volume profile in the plot, so I added one
Quick changelog
plot_configWhat's new?
Volume Profile
You can activate a volume profile in the plot. This can be activated by

'showVolumeProfile': 'true'inplot_configSplit volume by sell and buy volume
You can also split the 'normal' volume on the bottom of the plot in buy and sell volume. This can be activated by
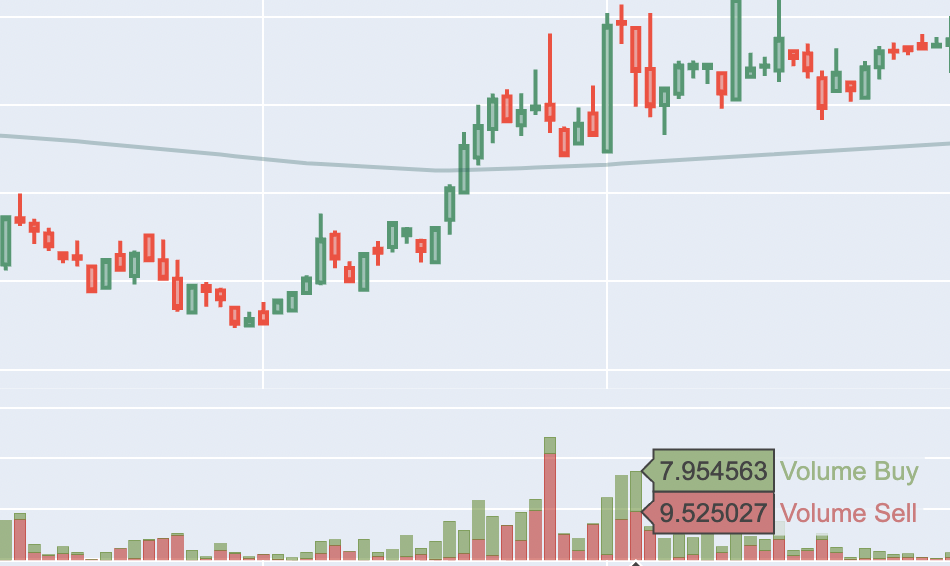
'showBuySell': 'true'inplot_configThis are all new possible parameters in the plot_config:
plot_config = {
'main_plot': { },
'subplots': { },
'volume': {
'showBuySell': 'true', #split the volume graph on the bottom in buy and sell volume; default: false
'showVolumeProfile': 'true', #show a volume profile on the right of the main plot; default: false
'VolumeProfileHistoryBars': 96, #define how many bars should be used for the volume profile; default: all bars in the plot
'VolumeProfilePriceRangeSplices': 100 # define in how many 'slices' the price is split up; default: 50
}
}
By default, all this is disabled.
Possible improvements
Next step could be to just show the volume profile for the zoomed-in area. Currently, the volume profile is always based on all data in the plot for the last x bars (see
VolumeProfileHistoryBars). It would be cool to dynamically calculate the vp based on the currently selected are/zoom.